Luxconn
Satellite-imagery AI that turns high-value properties into scored contractor leads
At a glance
- Platforms
- Web (Next.js), iOS and Android (Flutter)
- Timeline
- July to October 2025 (v1: July to September, v2: September to October, mobile: October)
- Team
- Solo on web v1 and v2; one collaborator on the Flutter app
- Commits
- 29 on v1 and 60 on v2, all mine; 7 of 11 on the Flutter app
- Deployment
- AWS Amplify (Next.js standalone build) with MongoDB and S3
- Status
- Archived
Overview
Luxconn is a lead-generation platform for home-improvement contractors. It pulls parcel data and satellite imagery for high-value properties, uses a vision model to estimate what could be built on a lot (ADU, pool, outdoor kitchen, deck, solar), scores the result and routes leads to subscribed contractors. I built both web versions alone between July and October 2025, then started the Flutter contractor app and built it with one collaborator.
The challenge
The goal was to replace manual door-to-door canvassing with software. The platform had to find high-value parcels in chosen US states and cities while staying inside a monthly Regrid API call budget. It had to fetch satellite imagery for each lot and get a vision model to say what could realistically fit there, with measurements rather than guesses. Leads then had to reach paying contractors in line with their subscription plan. The route map defines six roles (super admin, admin, support, contractor, franchisee, homeowner) that need different views of the same data. Every imagery and AI call costs money, so parcel lookups had to be metered and scans had to be pausable.
My role
I was the only engineer on both web codebases. In v1 (Next.js, July to September 2025) I built parcel lookup through the Regrid API, map screenshots with the parcel boundary drawn on, ADU placement recommendations using Gemini 2.5 Flash with yard-zone identification and setback checks, and shareable assessment pages with QR codes. From September to October 2025 I rebuilt the platform as v2, again on my own. v2 covers JWT auth with role-based routing in middleware, scan-area management with a monthly Regrid quota, the Mapbox and S3 imagery pipeline, and GPT-4o property analysis with a 0-100 score. It also includes AI 'visualize' renders using gpt-image-1 and mask-based edits, Stripe subscriptions with plans managed from the admin UI, and lead assignment by plan quota. The rest of v2 is direct-mail postcards, contractor messaging and appointments, support tickets, a knowledge base, 2FA, transactional email (moved from AWS SES to Resend), a voice-sales test page built on the OpenAI Agents SDK, and AWS Amplify deployment. In the Flutter contractor app I created the project and wrote the auth and session services, the contractor and visualization API services, and the Profile and Schedule screens. My collaborator added the dashboard activity feed.
Architecture
Clients
Web app
Next.js 15 App Router, React 19, Tailwind CSS 4
v2 has separate areas for super admin, admin, support, contractor and homeowner, plus public postcard and share pages. v1 also had a franchisee dashboard.
Contractor mobile app
Flutter, Provider, go_router, fl_chart, table_calendar
Dashboard, customers, projects, schedule and AI visualizations, calling the same /api/auth, /api/contractor and /api/dashboard/visualize endpoints as the web app.
Edge/Delivery
Role-based middleware
Next.js middleware, jose JWT in httpOnly cookies
Checks the session token on each request and allows each role only its own route prefixes, with an allow-list of public paths.
Services
Scan and parcel pipeline
Regrid API, ScanArea and StateScanProgress models, QuotaManager
Scans a state city by city for parcels above a minimum value, checks a monthly Regrid call budget stored in MongoDB before every call, and marks cities as quota-exceeded so a scan can resume the next month or be paused per scan area.
Imagery processor
Mapbox Static Images API (path overlays), AWS S3
Draws the Regrid parcel polygon on the satellite tile as a Mapbox path overlay, stores several map styles per property in S3, and processes properties in batches with delays, picking up pending or failed ones on the next run.
AI property analysis
OpenAI GPT-4o vision (v2); Gemini 2.5 and Claude 3.5 Sonnet (v1)
Returns JSON suggestions with dimensions, placement, a feasibility level and estimated values, plus a 0-100 overall score, following strict minimum-space and red-flag rules.
Visualization
gpt-image-1 / DALL-E 2 image edits, sharp, boundary-derived masks
Builds an edit mask from the green parcel outline or a model-chosen yard region, has GPT-4o rewrite the request into an image prompt, then renders the proposed improvement inside the lot.
Billing and lead distribution
Stripe products, prices, subscriptions and webhooks
Plans live in MongoDB with a monthly lead allowance and are synced to Stripe products and prices. A webhook route updates subscription state, and leads are assigned by score, then estimated project value, up to the plan's allowance.
Contractor tooling
Postcard generator with QR code, messaging, appointments, support tickets, knowledge base
Contractors generate a direct-mail postcard for a lead; each postcard gets a share ID and a view counter.
Data
Primary database
MongoDB with Mongoose (22 models)
Stores properties, leads, scan areas and scan progress, processing queue, subscriptions, plans, payments, postcards, tickets, messages, API usage, voice calls and activity logs.
Third-party
Email and voice
Resend, React Email, OpenAI Realtime / Agents SDK
Sends verification, password-reset and notification emails, and powers a super-admin test page for a voice sales agent.
Key decisions
- 01
Draw the parcel boundary into the image the model sees
I draw the Regrid polygon in green on the Mapbox satellite image, and that boundary image is what GPT-4o analyzes. The same green outline is later detected and turned into the inpainting mask. The model then reasons about the correct lot, and renders stay inside it. The trade-off is a dependency on Regrid parcel geometry being accurate.
- 02
Ask for measured, structured output
I gave the analysis prompt hard minimum footprints (for example 400 sq ft for a pool or detached ADU), red-flag rules and a four-level feasibility ladder. It makes the model estimate scale from visible references such as a car, driveway or sidewalk width, and return schema-valid JSON. Contractors get a reason they can check instead of a bare label. The dimensions are still estimates from a single image.
- 03
Score leads by source
Each lead records where it came from: ai_scanned, high_quality_homeowner or manual_entry. A homeowner who scans their own property gets leads scored from the GPT-4o result plus a 15-point bonus. Leads a contractor adds by hand are scored from the estimated project value. Assignment sorts by score, then project value.
- 04
Stripe pricing managed in the database
Super admins create and edit plans in the UI. The code creates the matching Stripe product and price, or creates a new price and archives the old one because Stripe prices are immutable. The monthly lead allowance lives on the plan. Price changes need no deploy, but the two systems have to be kept in sync through webhooks.
- 05
Meter the paid parcel API
QuotaManager keeps a per-month Regrid call count in MongoDB and is checked before every call. When the budget runs out, the city being scanned is marked quota-exceeded and picked up again later. Scan areas can be paused individually, and imagery processing runs in small batches with delays. This keeps parcel spending capped at the cost of slower scans.
- 06
Run Next.js on Amplify as a standalone build
v2 builds Next.js in standalone mode and ships it to AWS Amplify with a small custom server file. It takes AWS access from the Amplify IAM role instead of committed credentials. Getting environment variables to the server runtime took me several iterations across September and October 2025.
Results
- Replaced manual canvassing with an automated scan-to-lead pipeline across two rebuilds (v1 Jul–Sep, v2 Sep–Oct 2025).
- v2 scan pipeline: scan area, value-filtered Regrid parcels under a monthly quota, Mapbox satellite images with the parcel boundary drawn on, stored in S3.
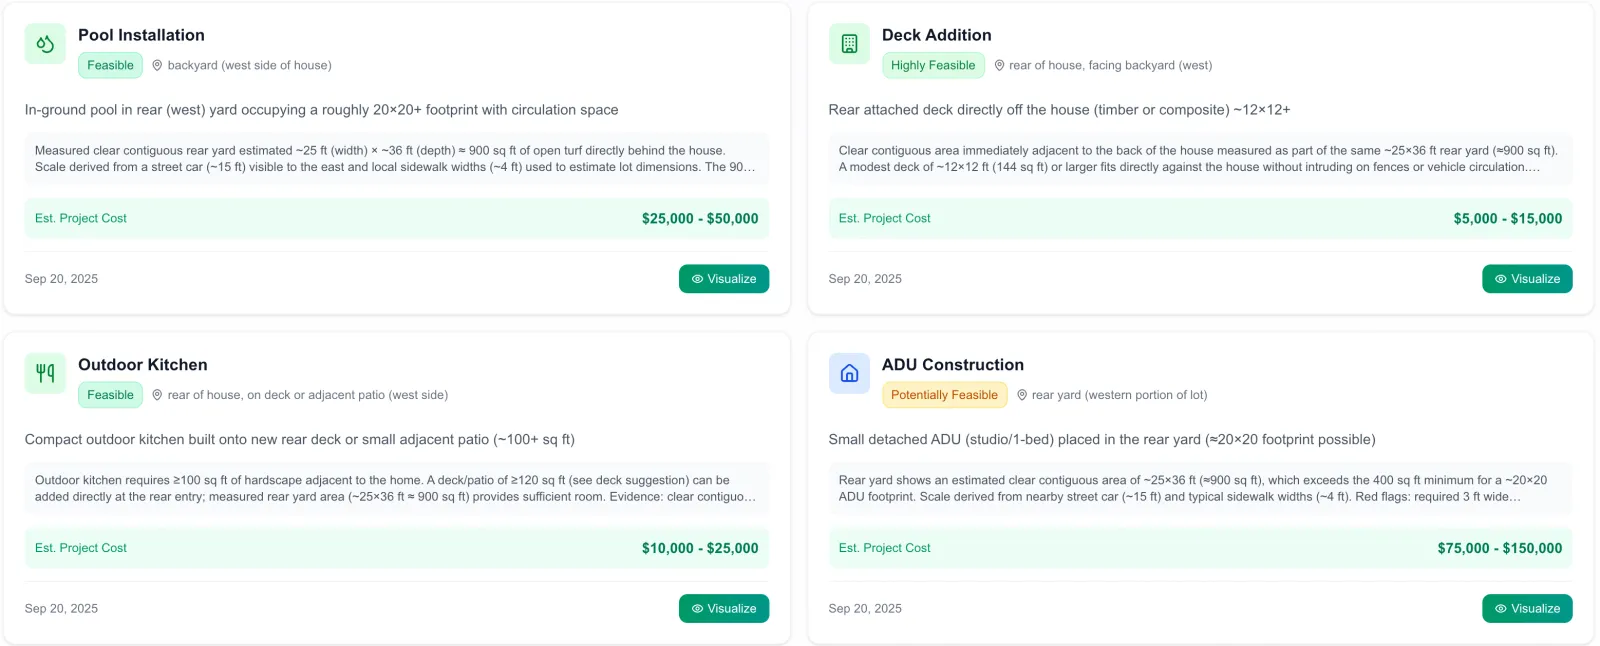
- Homeowner property scans run GPT-4o on the boundary image and return itemized improvements (pool, deck, outdoor kitchen, ADU, solar, landscaping) with placement, feasibility and cost range, then create scored leads.
- AI renders of proposed improvements using gpt-image-1 edits masked to the parcel.
- Contractor subscriptions on Stripe with plans edited from the admin UI, webhook-driven state and lead allocation by plan quota.
- Flutter contractor app for iOS and Android, wired to the platform's auth, contractor and visualization APIs.
Stack
- Web
- Next.js 15React 19TypeScriptTailwind CSS 4react-hook-formZodRechartsChart.js
- Backend and data
- Next.js API routesMongoDBMongoosejose / JWTbcryptjsspeakeasy (2FA)
- AI
- OpenAI GPT-4o visiongpt-image-1DALL-E 2OpenAI Agents SDK (Realtime)Google Gemini 2.5 (v1)Anthropic Claude 3.5 Sonnet (v1)
- Geo and imagery
- Regrid Parcel APIMapbox Static ImagesMapbox GLGoogle Mapssharp
- Payments and messaging
- Stripe (products, prices, subscriptions, webhooks)ResendReact EmailQR code generation
- Infrastructure
- AWS AmplifyAWS S3 with presigned URLsPuppeteer (screenshot automation scripts)
- Mobile
- Flutter / DartProvidergo_routerfl_charttable_calendarflutter_secure_storage